

Is a 1 minute or 5 minute chart better for day trading?
Preston's answer was the 1 minute chart, if you are a true day trader going in and out several times a day. If you can only make a few trades a day, he said a slower chart like the 5 minute is fine.
Here is the side by side. A 1 minute chart draws a new bar every minute, so you see a move as it starts. A 5 minute chart draws one bar every five minutes, so it is calmer but slower to show a change.
Preston also said he reads the 1 minute chart as an early look at what the 5 minute chart may show next.
Doesn't a 1 minute chart just give more noise?
Leander asked exactly that, and Preston said the noise is the point. In his view, a burst of activity is the stampede, and you want to notice it early.
He pointed to a stock from the week before that ran up in about a minute. On a 5 minute chart, he said, the whole move could be over before one bar finished.
What chart do investors use compared with day traders?
Preston said many investors use a slower chart, such as a 30 minute chart, and may hold for days. Day traders aim for small moves, so they cannot wait that long for a signal.
His short version: 1 minute for frequent day traders, 5 minute if you trade less often, and slower charts for investing.
Why set your exit before you enter a trade?
Preston said a fast chart works both ways. It can get you in early, and it can get you out early, so you need your limits set first.
He told viewers to decide on a target and a maximum loss before entering. He compared it to a pilot's checklist and to buckling a seat belt before you drive.
A stop-loss and a take-profit are how you write those limits down. Our position size calculator turns your max loss into a share count.
What did the pre-market list show?
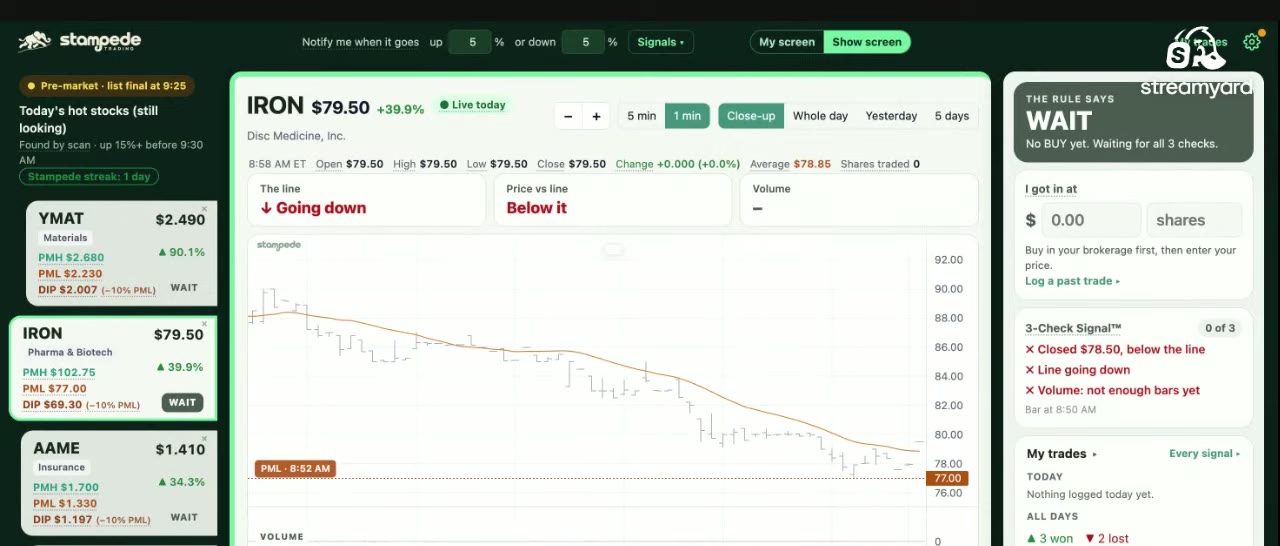
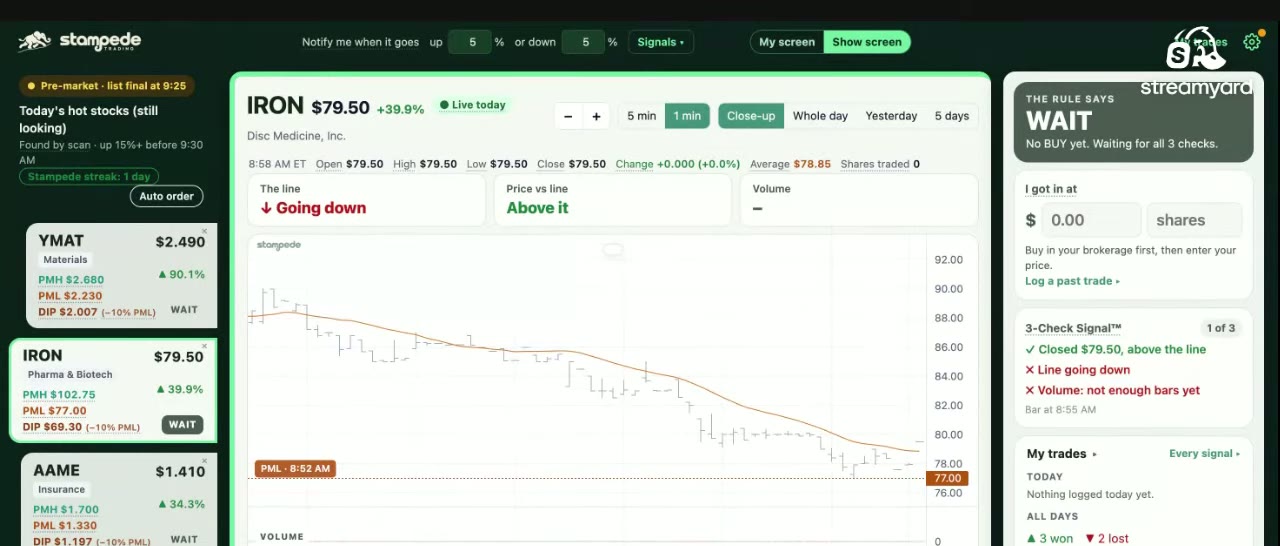
Next, the hosts opened the Stampede app at 8:58 AM Eastern. The watchlist on the side was sorted by pre-market movement, and Leander showed how to drag stocks to reorder it.
Preston noted that higher priced stocks are less likely to make huge one day moves than lower priced ones. So he focused on a lower priced stock with more activity.
On that chart he marked the pre-market high and the pre-market low. He said he watches for a break above the high or below the low, because that is where buyers and sellers show up.
How would you track this without the Traders Filter?
Preston said you would have to find stocks yourself, check volume, price and news, then set each price alert by hand. He guessed that takes about a minute per alert.
Across five to ten stocks a day, he said, that is hard to keep up with on a 1 minute chart. The app sends buy and sell alerts by text or email instead.
Leander added that the Android app is now live in the Play Store. This recap is education only and not financial advice.
Your move
In a practice account, open the same stock on a 1 minute and a 5 minute chart side by side, and note which one shows the first break of the pre-market high.
Terms used
Plan a trade with our free position size calculator or gap and risk/reward calculator.
Show recap · October 19, 2026