
Why does chasing a stock cost you in day trading?
Preston's answer: when you buy late, the move you wanted may already be over. Say a stock signals a buy at $2.00 while you are at work or driving.
By the time you buy, the gain you were aiming for could already be gone. His advice was simple: never chase a stock.
He pointed to AMOD from the day before. He said it lost about half its price in 20 minutes, which is how fast a late trader can be caught on the wrong side.
How do you know a signal is too late?
Preston's one rule for beginners is timing: go in when the notification comes, not after. Other traders run their own systems that act on the same move.
He said being even five minutes late can mean the stock has already turned the other way.
He also said to know your gain target and your stop before the day starts. In the app, the Standard setting alerts at +5% or -5%, and you can choose a different level that fits your risk.
What do the app's buy and sell signals check?
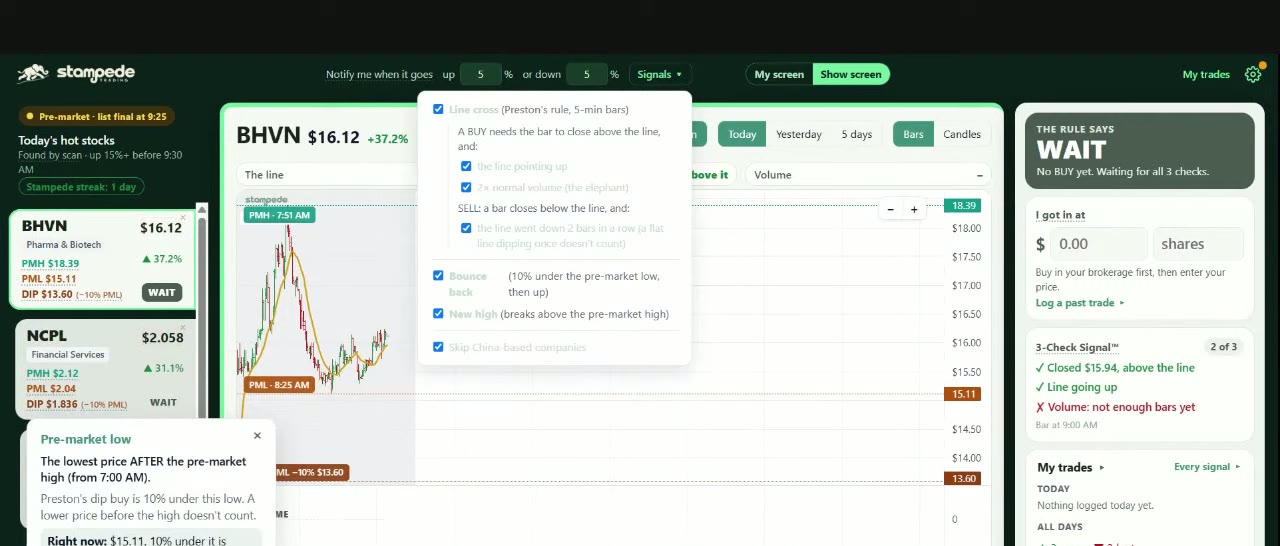
Preston walked through the Stampede app on the practice screen. A buy needs a bar to close above the moving average line while the line points up, and many traders also wait for about twice the normal volume.
A sell comes when two bars in a row dip below the line. You can also get a text or email when a stock breaks its pre-market high or falls 10% below its pre-market low.
The final pre-market list comes out at 9:25, and stocks can be added during the day as they qualify. The app would not add AMOD, because its price was too low for the Traders Filter.
How do you read a stock's pre-market levels?
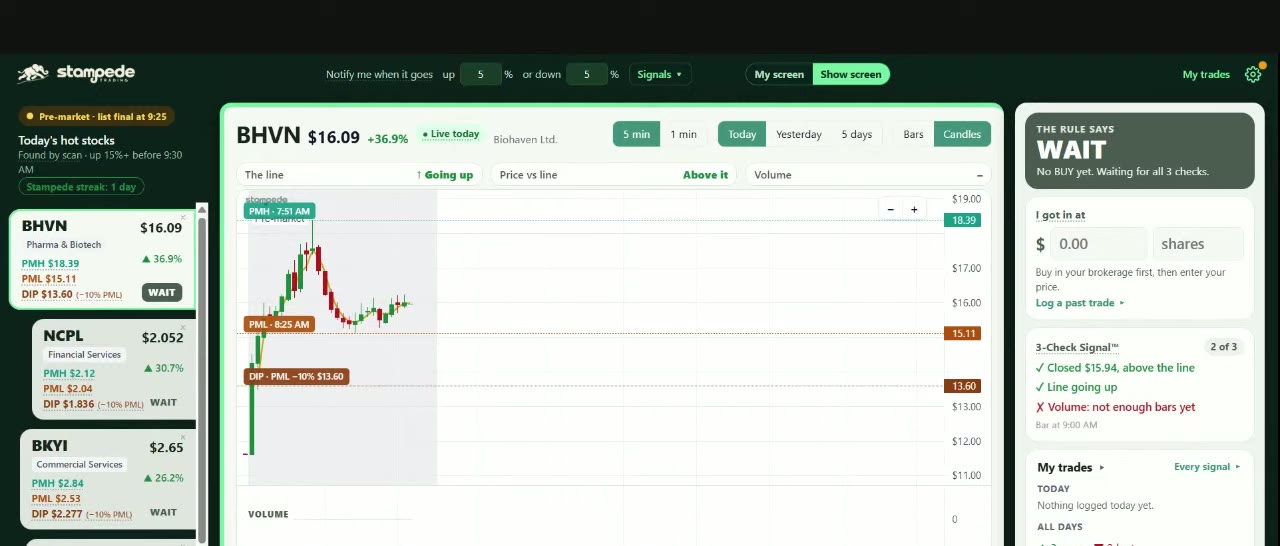
Mark the pre-market high and low, then wait to see which one price breaks. Preston used NCPL, with a pre-market high of $2.12, a low of $2.04, and a level 10% below the low at $1.83.
NCPL sat in the middle, so he said to be ready if it went above $2.12 or pulled back below $1.83.
He said a 1 minute chart suits someone at the computer all day, and a 5 minute chart suits someone who checks in every five minutes. Hovering over a bar shows its open, high, low and close.
The chart can switch between OHLC bars and candles. Preston prefers OHLC bars because he is red-green colorblind, and candle colors can look alike to him.
What did the day before's NCPL chart show?
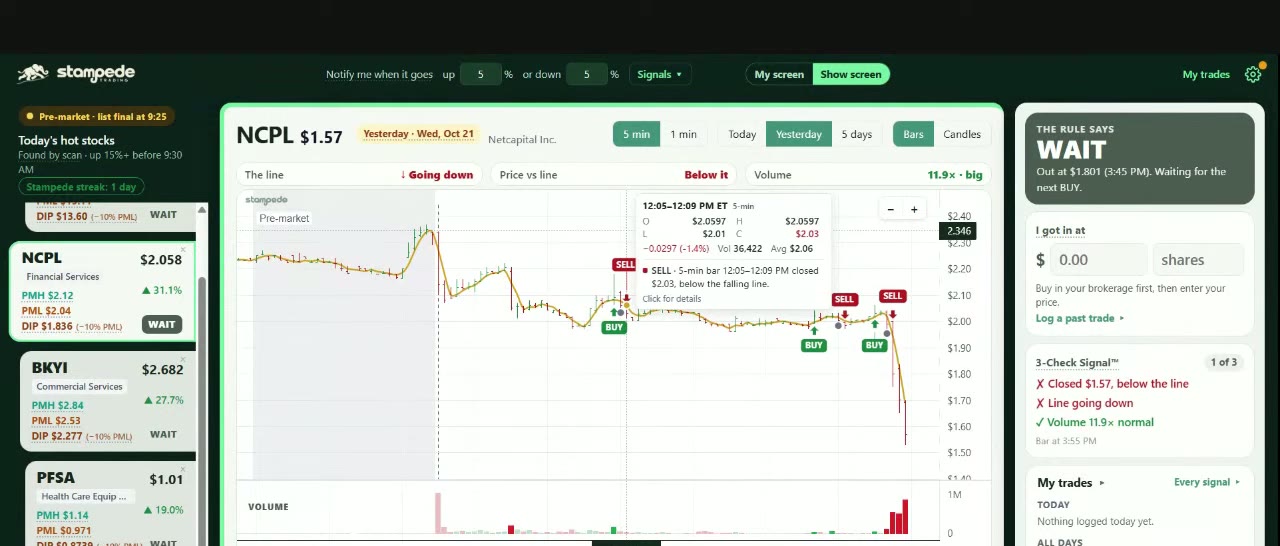
It showed the sell signal doing its job. NCPL gave a buy when it crossed above a rising line, then a quick sell once the line turned down.
A later move above the line came without the volume, so it was not a buy. Later still, all three checks lined up and held for about 15 to 20 minutes before a sell.
One buy at $2.02 sold at $1.985, and after that the stock fell off sharply. Preston said following the sell kept you out of trouble.
He added that the practice screen is not set to anyone's own levels. A stop set in advance keeps a loss from growing bigger than you planned.
What was the takeaway before the open?
Follow the rules, and test the system before you trust it. Preston said to use a paper trading account for at least 30 days and look for every buy and every sell signal.
Leander added one test for anyone who says they day trade: ask to see the actual buys and sells, at the times they happened.
This recap is education only and not financial advice.
Your move
In a practice account, pick one stock from the morning list, mark its pre-market high and low, and write down your stop before 9:30.
Terms used
Plan a trade with our free position size calculator or gap and risk/reward calculator.
Sources
Show recap · October 23, 2026